Participant User Behavior – How Participants Find & Register for Races
At RaceID we have a wealth of anonymized data from all the races and participants that we have on the platform. We also created a short survey that we sent to a panel of RaceID members to understand opinion and direction on the current trends in the market.
This article breaks down usage data from the RaceID platform to give you better insight on how the platform is used and what participants prefer. We combine this data with some interesting insights and opinions from our user survey to give you a transparent insight to how racers use RaceID today, and how you can use this data to learn and improve as a race organizer.
How are Participants finding races on RaceID?
The first thing to look at is how users are coming to RaceID. We looked at our internal data over the past 6 months and aggregated it to get the following chart.
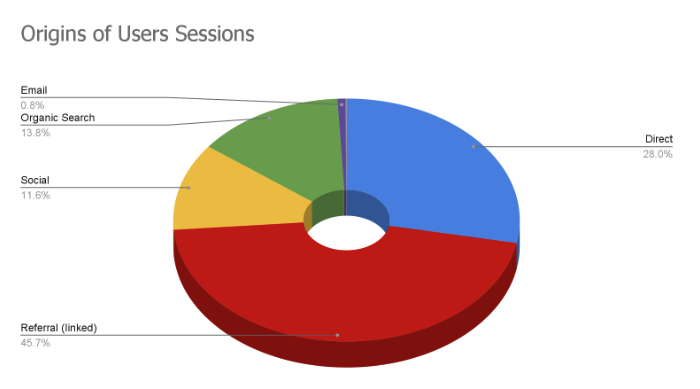
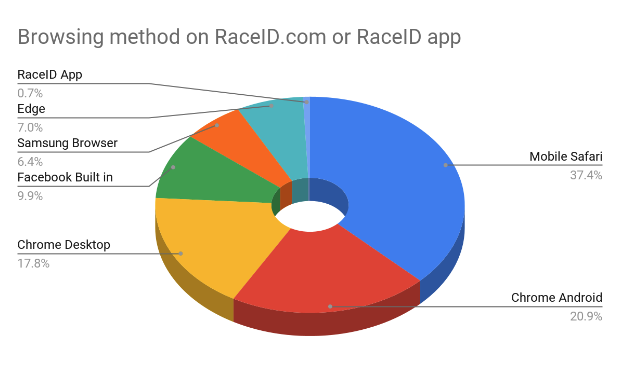
Then, looking again at the last 6 months of data, we averaged the monthly numbers, to see how users are visiting the site and finding races. The pie chart below shows how users are browsing RaceID:
Conclusions:
Referrals and Direct traffic make up the majority of users’ sessions. This means that most users come to RaceID after being referred by another site (usually a race website) or they come directly (by typing raceid.com into the browser directly). Organic Search is also significant – and greater than Social in this analysis.
Most users are using their mobile (or portable) devices to find races. Mobile Safari (iOS), Chrome on Android and Samsung make up 65% of all browsing! Only a small percentage have downloaded the RaceID app and use that though – definitely an area that RaceID can improve on!
Take away learning for race organizers:
Your potential participants are using their phones and devices to find races – make sure your website or registration platform is mobile friendly! Also the fact that Organic Search is significant means that your RaceID page (if you are in the calendar of course!) is ranking high when people are ‘googling’ for races or your race name – a great benefit for your race’s visibility and a source for new participants. If you don’t have your race in the calendar, make sure to add it (it’s free, even for races that don’t use the RaceID EMS).
How are Registrations Being Made on RaceID?
How does this compare to how participants actually register for races? What’s the easiest and best way? We looked at the same 6 months.
Conclusions:
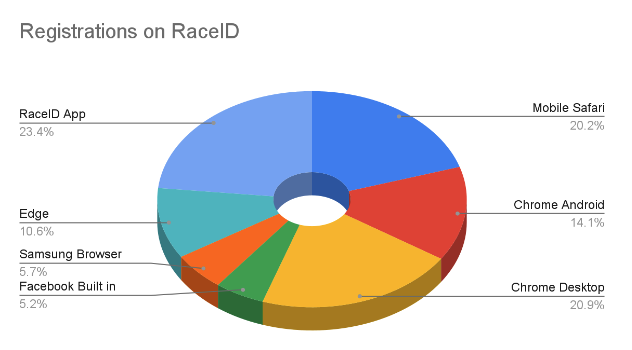
The most popular way to register to a race is through the RaceID app. Despite less than 1% of users browsing with the app – over the last 6 months more than 23% of users register to a race by using the app! In fact for one of the months, app registrations accounted for 45% of all RaceID registrations! This points to two things. Either that users know which exact race they want to register for when opening the app – or, they get served a recommendation through the app news-feed that matches their preferences and allows them to bypass the browsing process.
Other conclusions to take away is that mobile use stays high (both Mobile Safari and Chrome on Android stay significant). Chrome on Windows at 1 in 5 registrations, increases slightly relative to those using it for browsing – showing a trend that some users at least put down their devices and open up their windows machines. This is more than accounted for in the drop in Facebook use – suggesting perhaps that users will click a link on Facebook to browse RaceID, but do not trust Facebook enough to use the built in browser to make the registration.
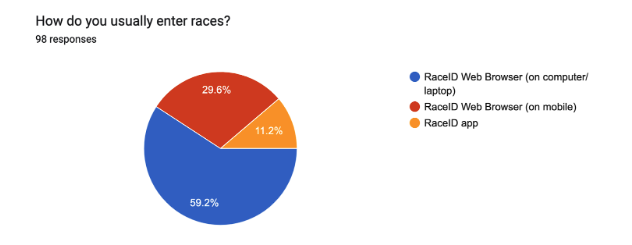
In a recent survey in 2023 we asked our participants;
Conclusion:
People mostly in the survey group still want to register through web browsers. It doesn’t match so well the actual data on race registrations (above). This would be interesting to see if this changes over time, or converges with the real-world data we have.
Take away learning for race organizers:
App use is big. Participants prefer to use the app above everything else. This means that they find it the easiest way, or it’s the safest and most secure. Or both. If you already use RaceID for your registration, encourage your participants to download the app!
Finding and entering a race on RaceID – what’s the preferred method?
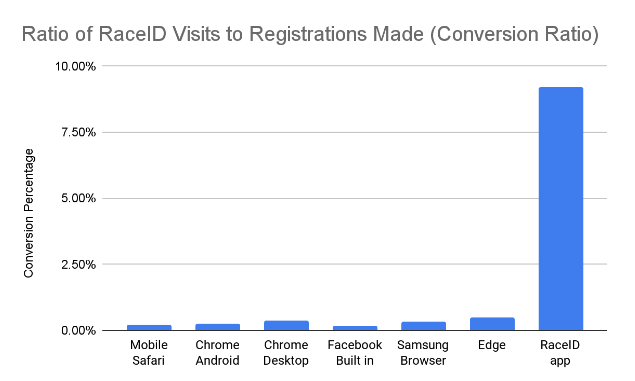
If we look a the ratio of browsing (visits) to whether the user actually made a registration we can see clearly, for the same 6-month data range:
Conclusions:
The RaceID participant app has a conversion rate of nearly 10% – which makes it more than 20 times more effective than any other method – in terms of successful registration. This shows that users find it far easier and better to register through the app. A clear buying preference!
As an organizer, this means it’s a good idea for you to encourage your participants to use the RaceID app!
The total conversion rate (all sources added together) is 1.6% – fairly highly reported considering actual data on registrations made through the app.
Take away learning for race organizers:
If the registration platform you use has an app that potential participants can use to register to your race, then you should seriously consider this as a huge positive! It is clear that participants’ user behavior favors the use of apps for registrations (when they know that one exists – something that we at RaceID need to get better at). App users are also more likely to register more often and for multiple races.
In which countries is RaceID most popular?
We averaged our registration numbers to get to our Top 5 counties right now.
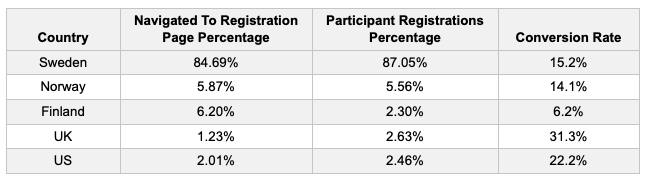
We can see that Sweden is by far the biggest market we have for participants. Other Nordic countries follow in terms of visits. The UK and US round out the top 5 but only account for 3 percent of total visits combined. With registrations, the UK and US actually move up, with Finland moving down.
Take away learning for race organizers:
If you host a race in Sweden – or even within the Nordics, then congratulations – most of your participants will know about RaceID, have an account or maybe even downloaded the app. If you are from a country outside of the Nordics, then congratulations – you could be one of a select few race organizers that could offer the RaceID experience to your participants! Get ahead of the game – create an account and get going with RaceID now – you can see that the conversion rate on visits is pretty high! While being the largest in our home country, RaceID is growing quickly in other European countries as well – race organizers are using the platform in over 40 countries around the world.
Data holds many truths, as we can see in the visualizations above. It is important to track and analyze data regularly to be able to draw insights so that we can improve. Are you doing this for your race each year? If not, get tips on user surveys and participant data analysis in this how-to article.