Calculate the Carbon Footprint of Your Race
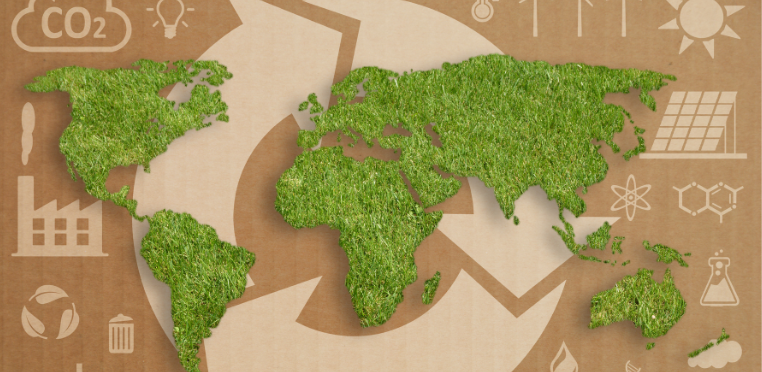
How Much CO2 Does My Race Produce?
It’s difficult to know our impact on the environment – there are so many interconnecting factors and variables to consider. A common way to measure an individual’s, object’s, service’s or product’s impact on the environment is to calculate how much Carbon Dioxide emissions it produces, it is sometimes called your Carbon Footprint.
We have been digging into the data from various sources with the goal to develop a simple calculator to *estimate the CO2 impact of individual races. We also give the equivalent number of trees to plant, if you were to offset the emissions connected to your event by planting new trees (this, because they “eat up” the Carbon Dioxide and produce oxygen when they engage in their photosynthesis). Ambitious? We think so! But that’s what we love to be 😉
Download the Carbon Calculator for Races
Note: This is not a carbon offset certification or similar – it is intended as a calculator for personal use only, for you to get a grasp on how much impact your race has on the environment. Therefore; results, data and references should not be used for ‘official’ publication.
*Estimate in this case means an accurate to within an order of magnitude (i.e. the real value is within a factor of 10 from the estimate).
Watch this video with Hector explaining the Carbon Calculator:
Assumptions, Explanations and Sources Around Our Emission Calculations
To be as transparent as possible, here is a small discussion on the methodology and limitations of the calculator. Read on if you have interest in this. Feedback is always welcome – if you have an idea on how to improve it, a better source, or a reasoned methodology for change, we would love to hear from you.
Transportation Emissions Associated With Races
This was by far the easiest to quantify – using data from the GHG Emissions database it is easy to accurately and reliably assess the impact of every participant kilometer traveled to your race. The uncertainty comes in the estimation of how your participants get to your race. To get a good handle on this, we recommend a survey of your participants. This is best done at the race itself (as they pick up their bib numbers for instance or when they walk into the arena). Just two simple questions; How did you get here today? How far did you travel to get here? You could then extrapolate such data for next year.
Another method would be to estimate an ‘upper’ bound and ‘lower’ bound for your race. Important parameters to the calculation are number of participants and how they travel. So an upper bound would be the maximum number of participants, traveling the maximum distance/time to your race. The lower bound is the minimum number of participants, traveling the minimum distance/time to your race. Compare these two values to understand where the ‘real’ carbon emissions due to transportation will be.
It is worth noting that unless you hold a super-local race, transportation will likely make up the majority of associated emissions.
Sources:
- https://ghgprotocol.org/ghg-emissions-calculation-tool
- https://www.iea.org/fuels-and-technologies/electricity
Emission Estimations Based on Locality of the Race
For regions and localities, data was collected about the surface area of each continent, then dividing this number by the number of ‘significant’ countries within the continent (we exclude very small nations). This created an average-surface-area-per-country in any given continent. For instance, in North America, we divided by 3, and in Europe we divided by 43. The square-root of this number thus gives the ‘average’ width or length, in a very crude estimate, of any given country within that region/continent. This ‘domestic distance’ can then be used to calculate transportation costs of t-shirts, medals, food, etc within regions and locally within countries. We will say again, it is a very rough and crude estimate, but it sits within the error bounds we set ourselves – to get within one order of magnitude of the right answer.
As a side note, carbon emissions of various transportation systems are based on CO2 per passenger kilometer. When deciding on CO2 per medal kilometer, we assumed an average ‘passenger’ weighs 70kg (roughly accurate based on adult demographics globally) – and dividing by this to get CO2 per kg kilometer.
Emissions from Race T-Shirts
The Carbon Trust, a UK NGO, has produced a ‘Clothing Report’ which details the carbon emitted by different clothing types, and breaks it down into production, transportation and use. The report is from 2011, so likely the data is a little outdated and probably sits on the high side of estimates relative to t-shirt production nowadays. However, we considered this to be a conservative way of estimating, and hence considered ok. In any case within an order of magnitude of the ‘correct’ figure. A t-shirt was estimated to weigh 125g.
Source: https://www.carbontrust.com/resources/international-carbon-flows
Emissions from Race Medals
This was a more tricky estimation to make. We assumed that medals were made of zinc (most metal medals have a base material of zinc). Each medal was assumed to be 50g. The calculation is simply the carbon emissions for producing that amount of zinc. The ribbon and other things that make-up medals have been excluded as negligible. This probably produces a slight underestimate, and there are certainly medals that weigh more than 50g. In these cases, you should consider multiplying the figure by a small percentage. If your medal weighs 100g you could double the base cost – if 75g, you could multiply by 1.5, etc.
Source: https://www.mdpi.com/2075-163X/7/9/168/pdf
Emissions from Race Goodie Bags
A favorite amongst many types of events, the goodie bag creates excitement amongst your competitors at bib-collection. For the small goodie bag, it was assumed that a PET water bottle and a number of printed leaflets and advertising was included. The medium and larger bags are 2x and 4x the smaller bag respectively. If you have significant items (food, etc), this can be estimated in the race food section or with additional appropriate factors.
Sources:
- https://www.nature.com/articles/npre.2009.3407.1
- https://projectsites.vtt.fi/sites/leader/www.vtt.fi/sites/leader/en/adv_leaflet_cf_2010.pdf
Emissions Associated with the Race Arena
The Race Arena is a complex thing to calculate, each race arena is very specific and unique and a truly accurate assessment is impossible. Regardless, we endeavored to get a handle on an estimate for small, medium and large arenas. A small arena was assumed to be a few plastic signs, a few steel barriers and a roll of tape. Data for this calculation came from the UK Governments Report and Calculation Tool to assess carbon within a construction project. A medium arena was assumed to be 3 times the size (and thus carbon) of a small arena. A large arena was deemed to be around 2 times the size of a medium one. If anything, this could lead to an under-estimate of a newly purchased race arena – however, it is appropriate to assume some reuse of equipment and signage – which can account for and balance this underestimate.
Source: https://www.gov.uk/government/publications/carbon-tool
Emissions from Race Timing Equipment
A pen and paper were fairly easy to estimate based on a couple of sources. Even if this estimate is wildly inaccurate, it is so small as to not matter for the overall calculation. The Timing App is based one the electricity required to charge one mobile device. A conservative estimate of 20 Wh still gives a value that is around 5 times smaller than the pen and paper.
The chip timing equipment is far more difficult to estimate. Here we assumed that for the average race, of around 500 participants they would need ‘10 computers’ worth of digital gear (approx. 1 laptop, 3 decoders, antennas, mats and tags). Converting the amount of timing gear into equivalent computers makes sense as a computer has a fairly well documented embodied carbon nowadays.
Obviously, large events will need to multiply this value up if they have lots of gear. An event with 5000 participants though is not the same as 10×500 participants. There are economies of scale with timing equipment, so this should be considered.
To calculate the carbon when reusing equipment, we assumed an average age of 15 re-uses. Obviously, some equipment has been reused a lot more – but there’s also a lot of new equipment out there too. For a ‘Timing Company’, we estimated that they use gear more often, and estimate 10 times the amount of use relative to normally reusing. We therefore divide the carbon from the new equipment by the average age to estimate the carbon for reuse of timing equipment.
Sources:
- https://ethicalstationery.com/its-just-a-pen-right/
- https://www.sciencedirect.com/science/article/abs/pii/S0959652611004409
- https://www.ed.ac.uk/files/atoms/files/pc-carbonfootprints-jh-ecci2.pdf
Food and Aid Station Emissions
To get a handle on your after-race party and all the post-race bananas you are providing, we made an estimate of how much food each participant consumes for races with a couple of aid stations, races with multiple aid stations and races with after-run food. We started by finding data on CO2/2000kcal for different diets, in different localities (the source of the data was a scientific study conducted in 2014 on diets in the UK). This data was then added to transportation depending on where the providence of the food came from. We then estimated how many calories are consumed by each type of event. With ‘1-2 Aid Stations’’ this was considered as 500kcal per participant, for ‘Multiple Aid Stations’ we assumed 1400kcal of consumption and for ‘Aid Stations and After-run Food we assumed 2200kcal.
Source: https://link.springer.com/article/10.1007/s10584-014-1169-1
Tree Equivalent to Offset Emissions from Your Race
How much CO2 does a tree absorb? Well, this is a debate bigger than this blog allows for and research shows many different answers. However, we have taken a conservative figure and will review the data as an ongoing process. Each tree is different, some will grow fast, some slow, some will sequester more carbon than others (depending on species and locality). Currently we’re using the calculations used by One Tree Planted based on Winrock International’s Carbon Storage Calculator, which works out (on average) at 10kg of CO2 per tree.
If you are interested in how to plant more trees through your participants’ kilometers, you can check out Earth Runs for all the great work they are doing in this space. Here you can also get 5 ways to make your race more sustainable.