How to Predict Race Registrations?

Is it possible to predict race registrations?
We know that one of the major insecurities of any race organizer is how to predict how many participants will sign up. Wouldn’t it be great if we could predict with some degree of accuracy the amount of registrations, and hence revenue we could expect? Predicting the numbers during your registration period would allow better planning and expenditure. Especially when it comes to things like medals, t-shirts, goodie bags or even food that have to be pre-ordered well in advance of the actual race day.
At RaceID, we have a wealth of historic registration data and are working on new features to help you predict your final numbers. This blog article provides the first indication of how we are able to analyze the data and also to predict final participant numbers.
What do Registration Numbers Look Like Over Time?
Usually, you’ll open registrations long in advance of your race. This is to give yourself the best chance at reaching a high number of participants. However, numbers tend to stay small in the beginning, with the rate of registrations continuing over time. Most races get the majority of their registrations towards the end of the registration period. This is why it is so hard to predict the outcome in advance. Learn about how to manage late registrations here.
Luckily, we’ve been looking at our data and can see some interesting trends. In particular, cumulative registrations over time tends to be like simple polynomial growth. An example of polynomial is something like the equation a*t2+b*t+c. (We use ‘t’ rather than ‘x’ as for us it can be thought of as ‘time’).
Essentially, the relationship in this instance means that the rate of registrations (number of registrations per day, week or month) is proportional to time. So with a best-fit polynomial we are able to predict (within a certain degree of accuracy) the number of registrations at any given time. This is most useful when forecasting the total number of registrations on race day – and allows race organizers to plan ahead.
Growth Examples of Race Registrations
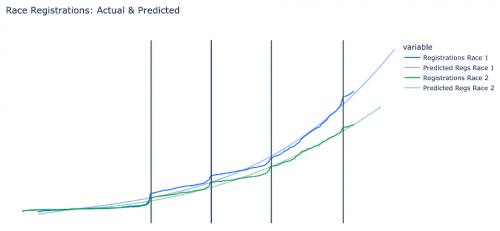
Let’s look at 2 large races on the RaceID platform:

As you can see from these two example races (2023), both open registrations quite far in advance of the race day itself, but the registrations only pick up gradually, with the majority being made in the final two parts of the registration period.
Note the 4 vertical lines. These are the dates of the price increases for these races. Correlating with these, we see a spike in registrations just before the price increase, particularly in the first two registration periods.
From the numbers (so far in 2022/2023), we can predict how many total registrations will be made by the registration deadline by fitting a trendline to the current data. Obviously, the final figure will be slightly different from the predicted. However, it should give a good idea as to what the final number will be. Both trendlines in the above example are best-fit polynomials.
Comparing Race Registrations in 2022 to 2023
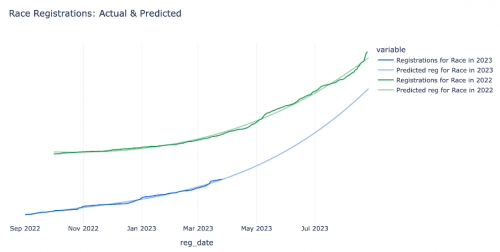
The below figure shows registration growth of the same race, from 2022 (Green) and 2023 (Blue). Note that, due to the pandemic, the race was postponed for two years, and entries were carried forward – hence the number of registrations at the ‘start’ of the 2022 registration period is large (and not zero).

In this real-world example, we can see that the growth of registrations can quite accurately be described by the best-fit polynomial curves. For both 2022 and 2023, the curves are third degree polynomials. However, we can see that 2023 registrations are happening at a faster rate (the curve is steeper). Positive news for this race! Although the actual size will be smaller than 2022 due to the carried over registrations from the postponed editions of 2020 and 2021. We can also see that the small price increases are causing the curve to be ‘shifted’ to the left, meaning more earlier sign-ups.
Conclusion
Growth in registrations for races can be predicted fairly accurately through simple best-fit curves. If you’re a race organizer, take your historic registration data and plot the cumulative registration number against time (or date). Look at the shape of the data points and fit a curve to it. You can use this information to make predictions for upcoming races, or even to compare against other races in your region (if you share data with race director friends).
One positive worth highlighting in the data that we are seeing at RaceID is that race registrations are looking to be growing at a faster rate in 2023 than in 2022. This proves that participants are finally coming back into ‘race-mode’ after the pandemic hiatus!


